TAIO Indicator
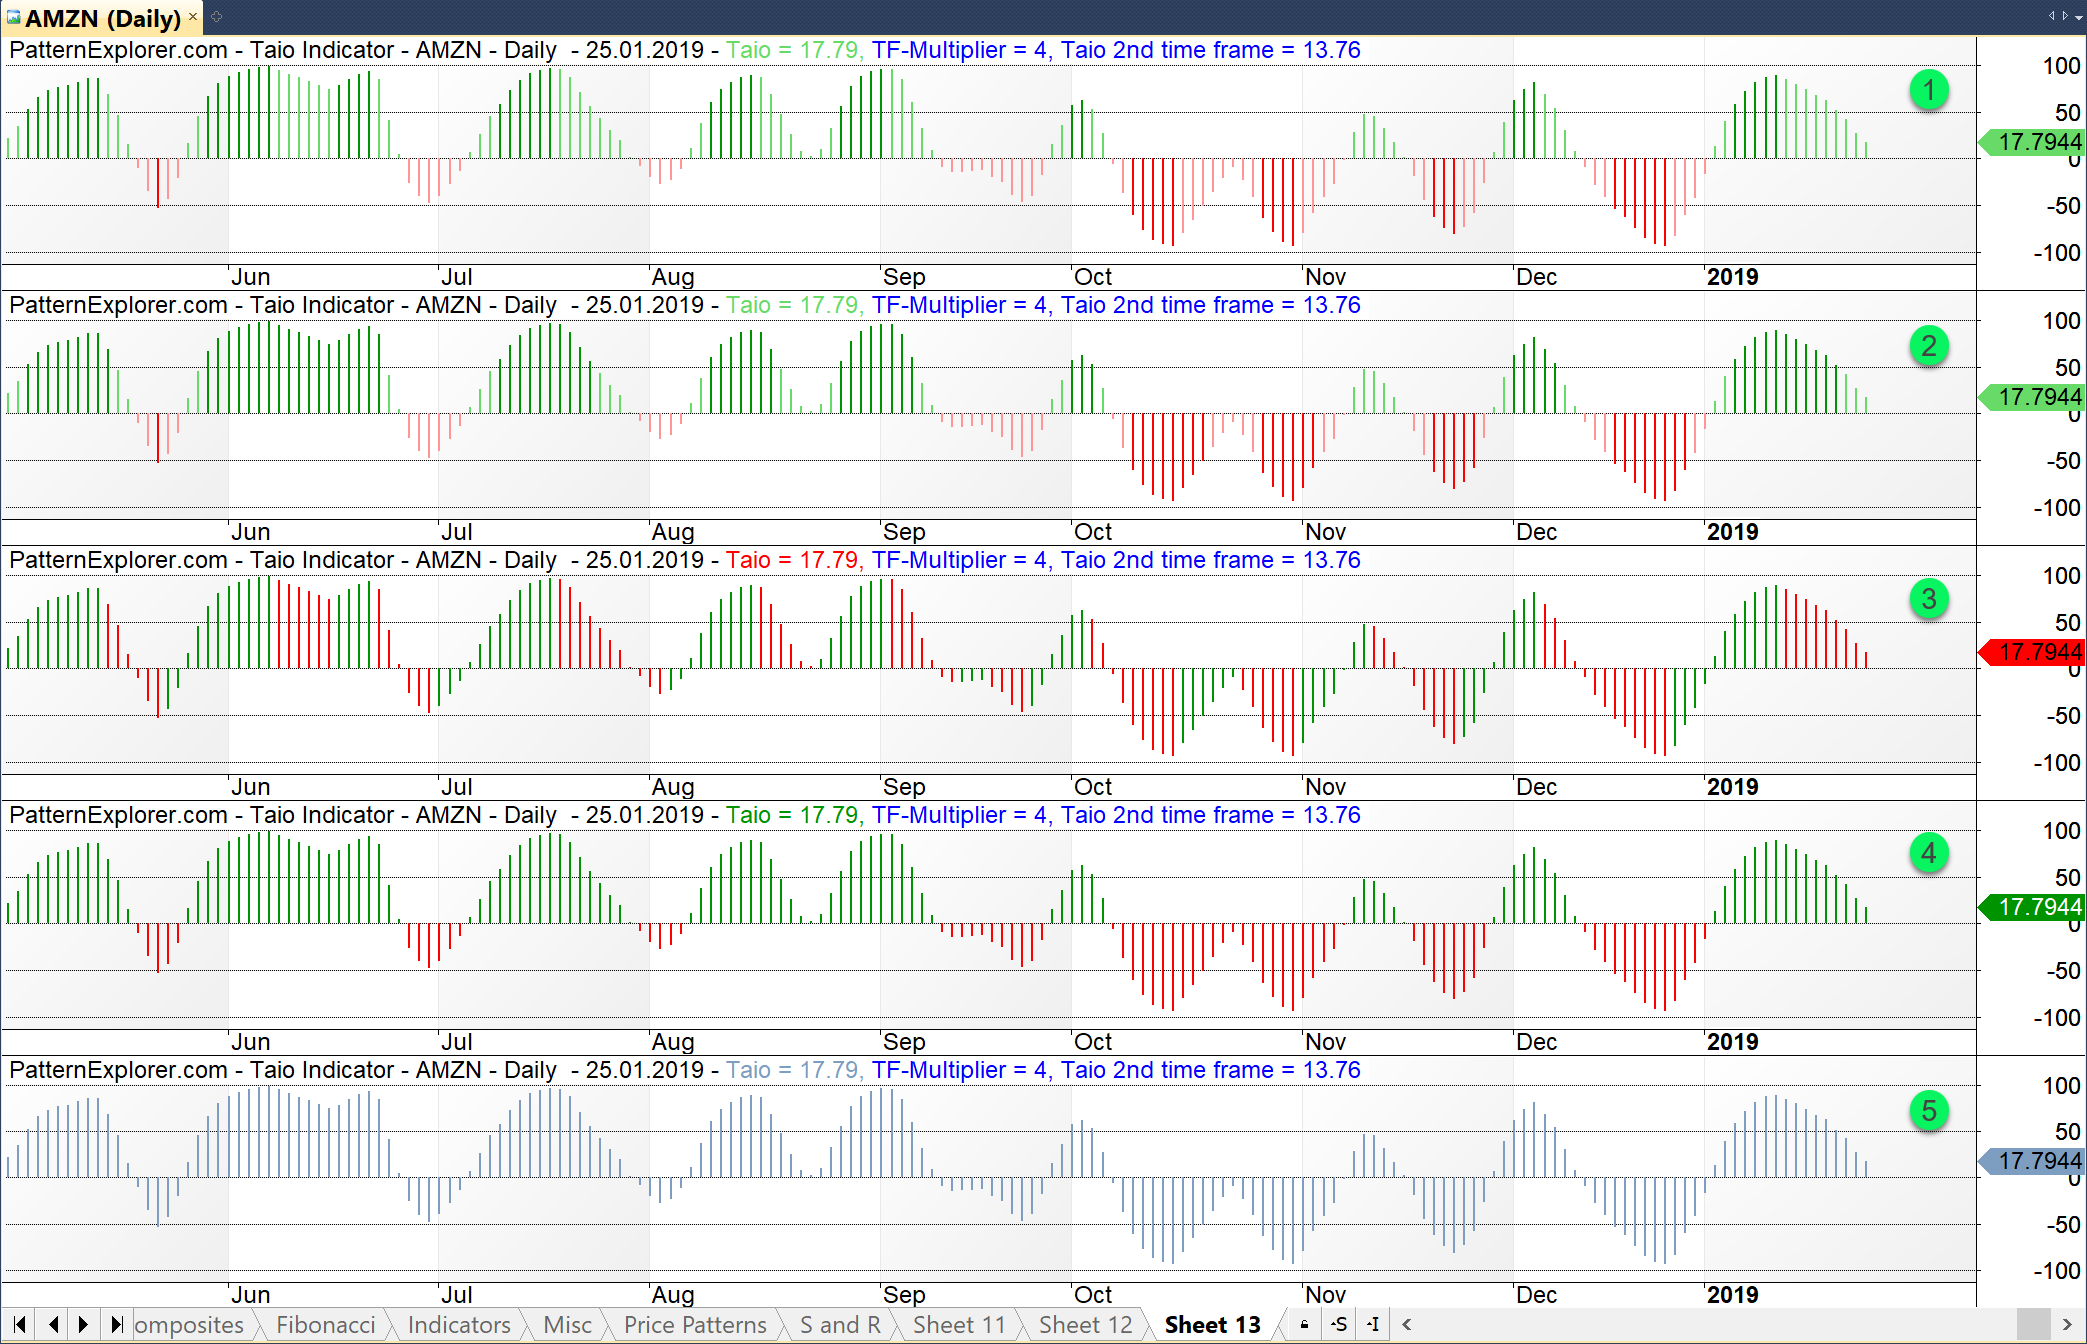
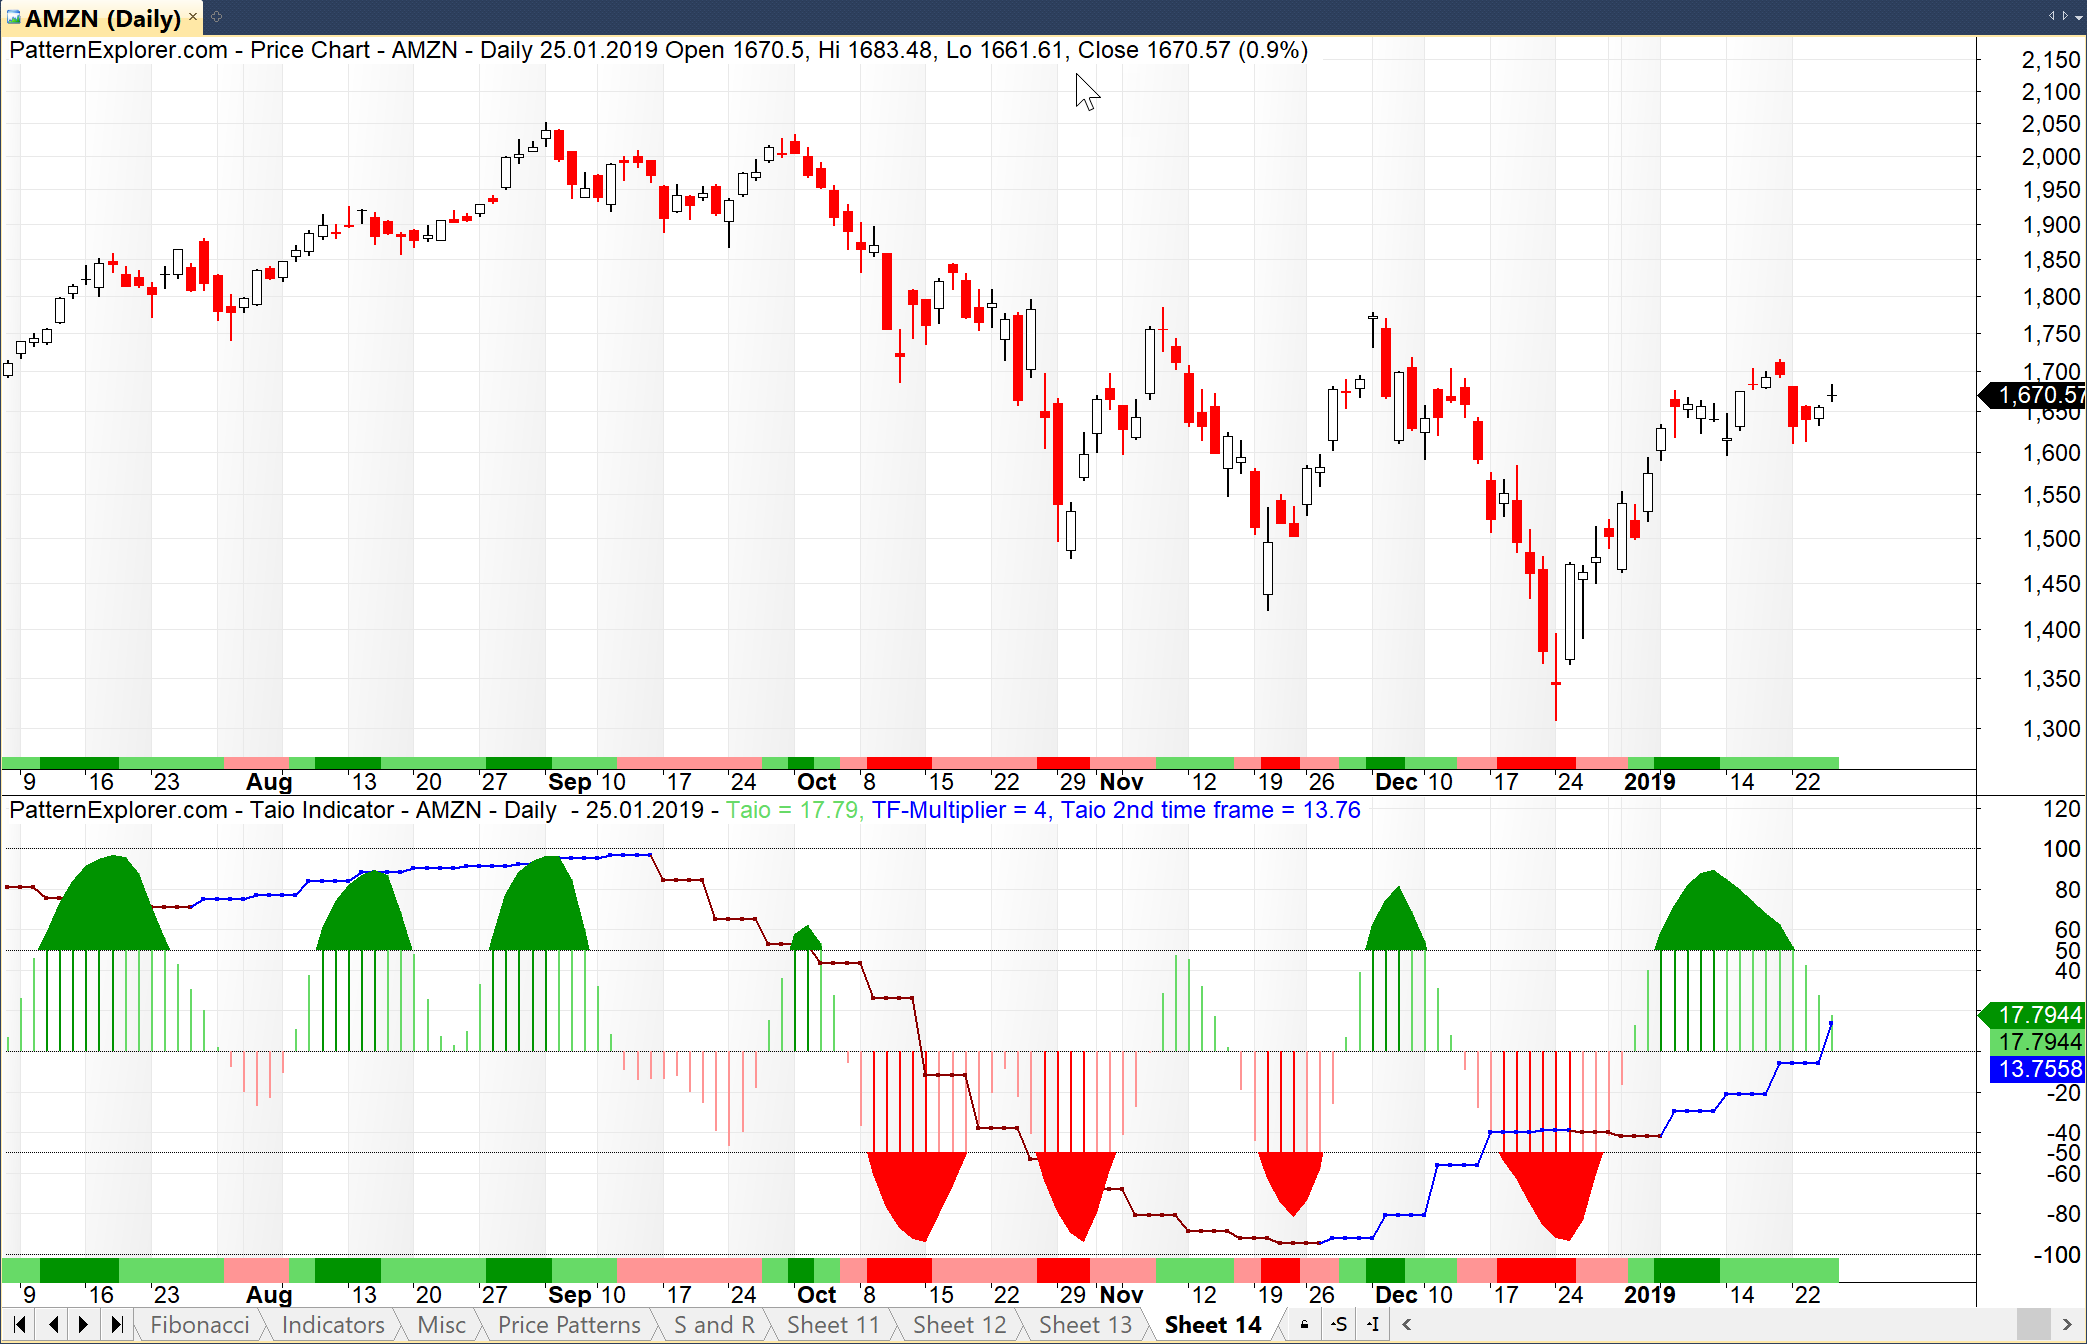
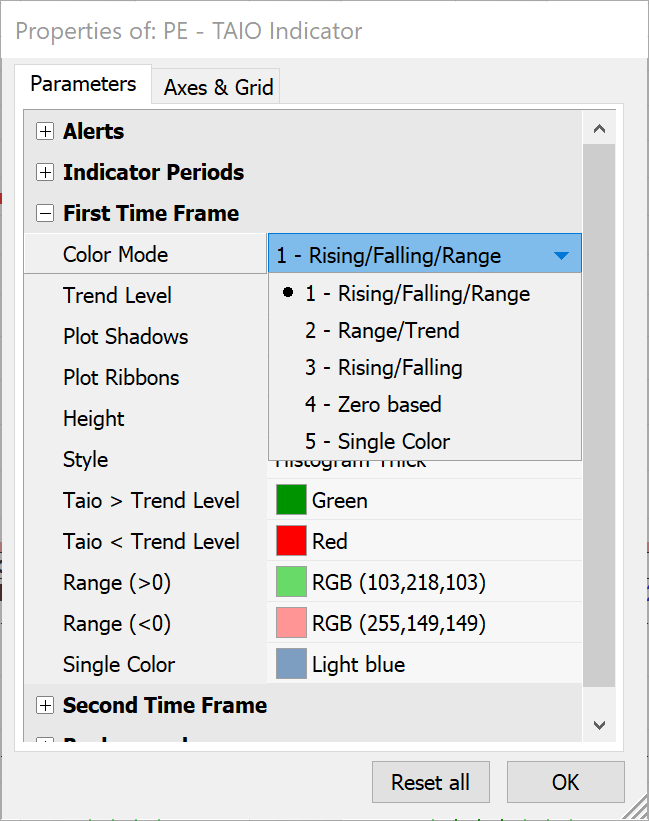
The TAIO indicator is useful for detecting overbought/oversold and trend conditions. Multiple color modes are provided to color the indicator on the behavior of the indicator. This coloring is also available in the price chart and on the ribbon bar. The indicator can also be displayed in a higher time frame to see the trend of two intervals at the same time.
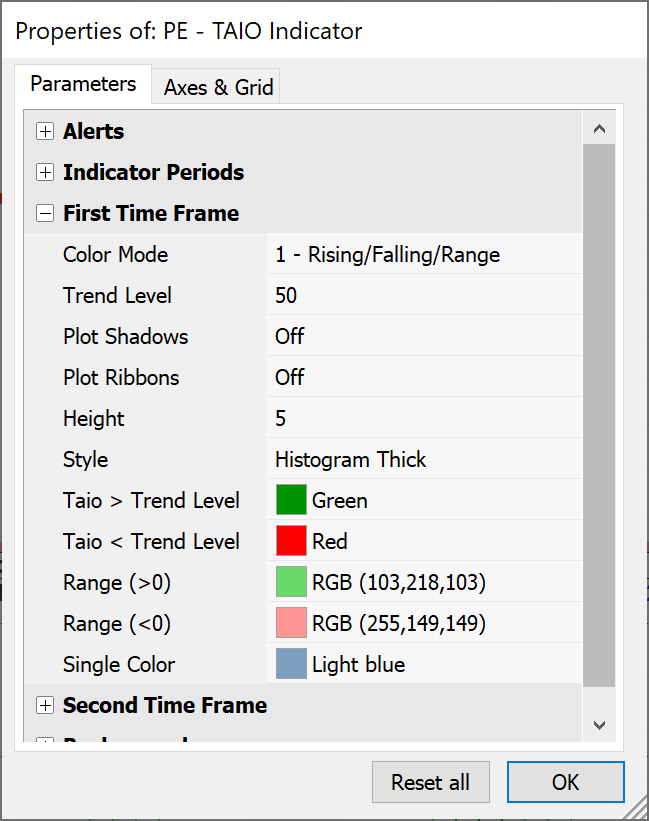
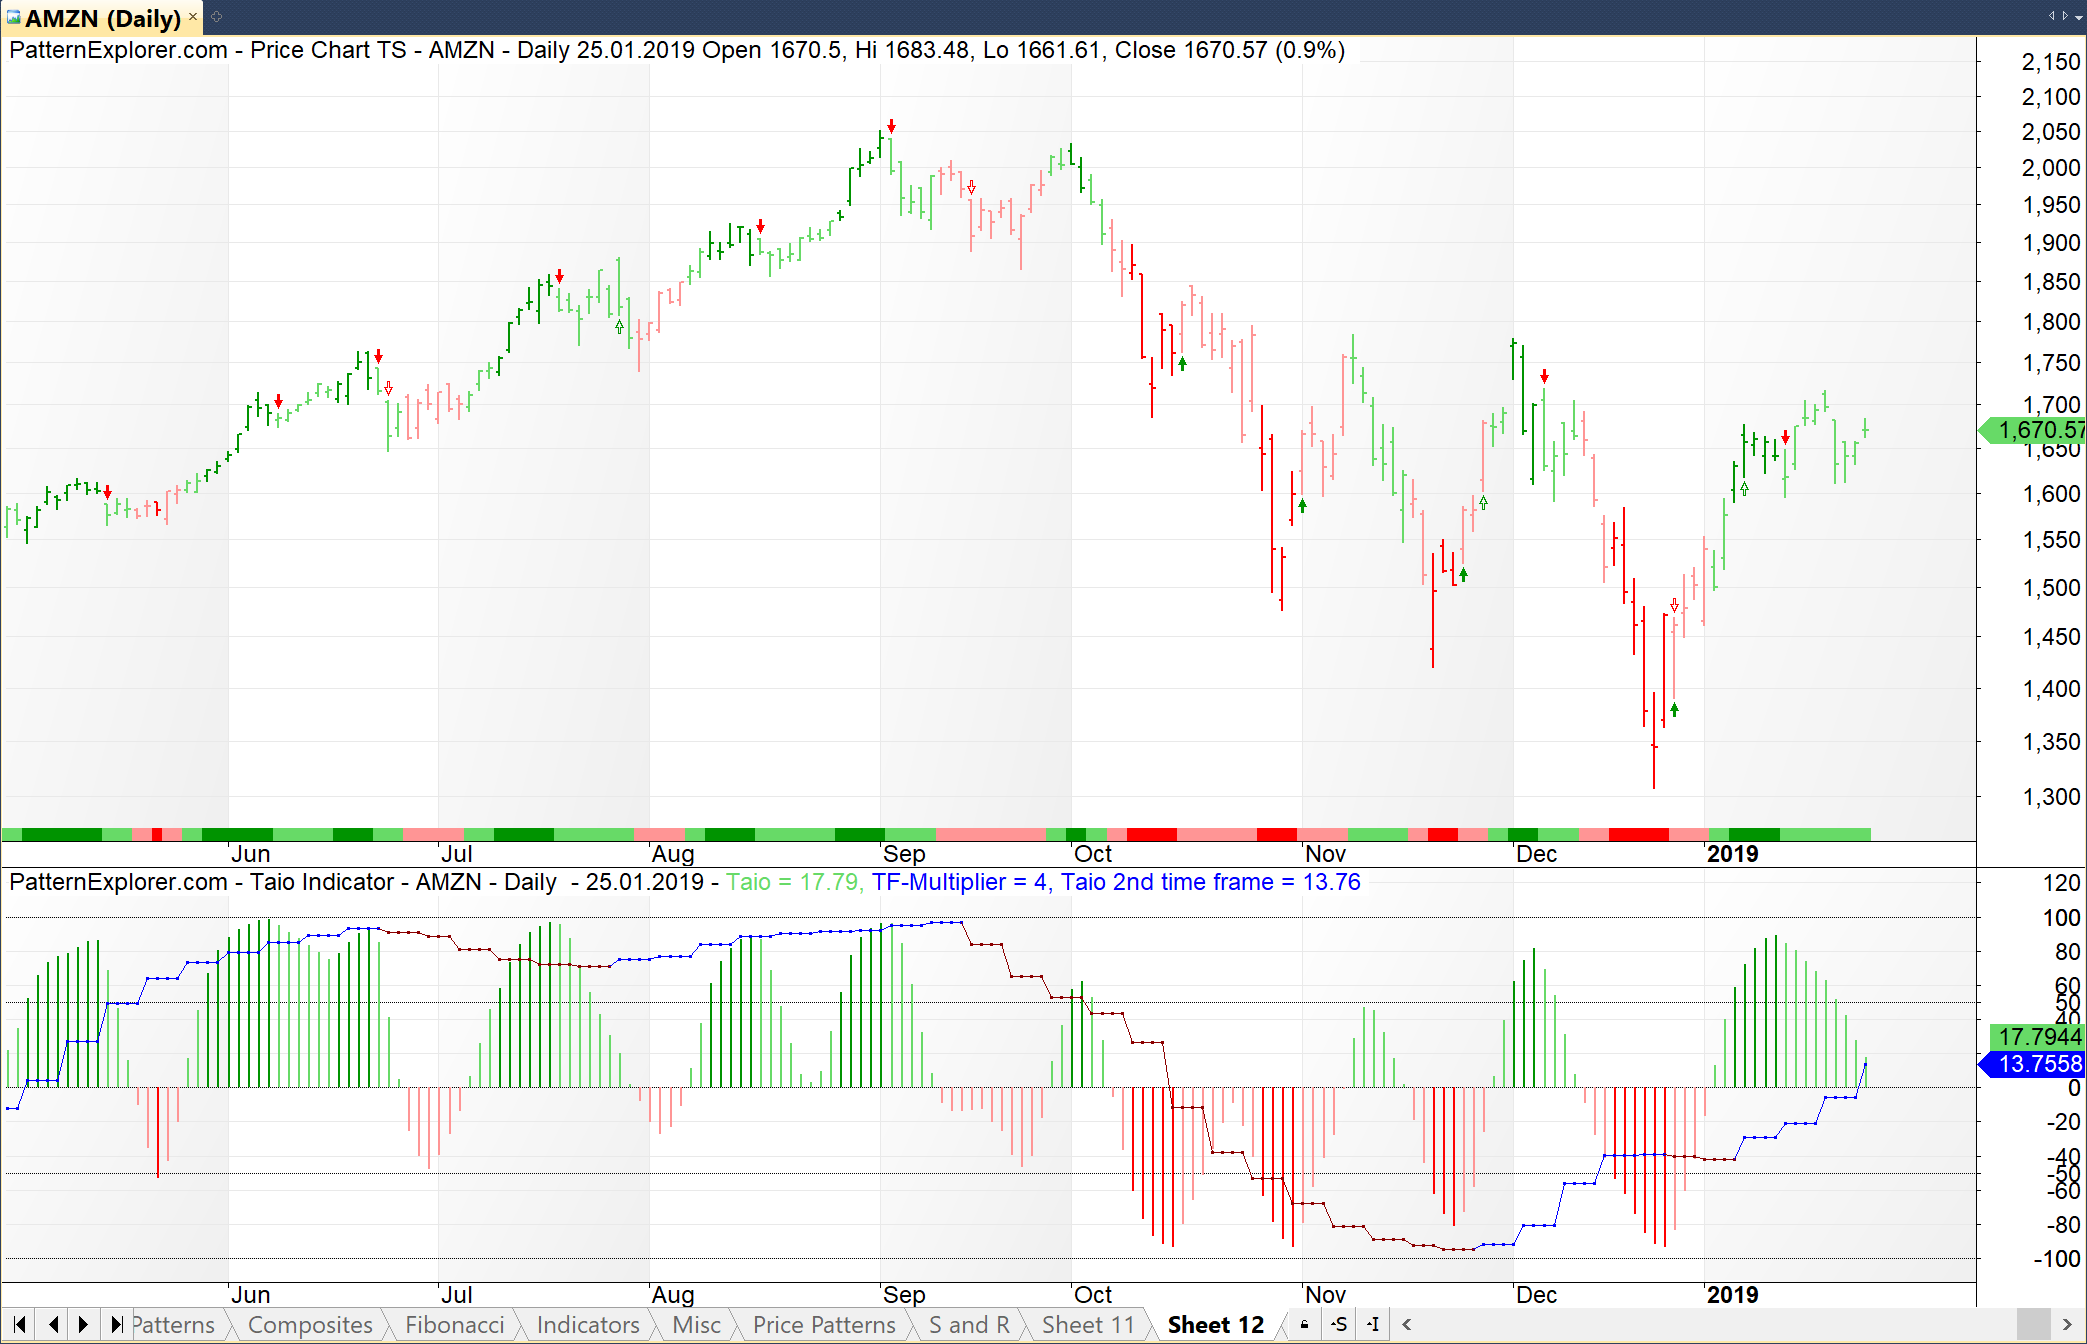
The default “Trend Level” value is defined with 50 which means that a trend is detected if the indicator value is above +50 for uptrends or below -50 for downtrends.