PE – Rainbow Chart

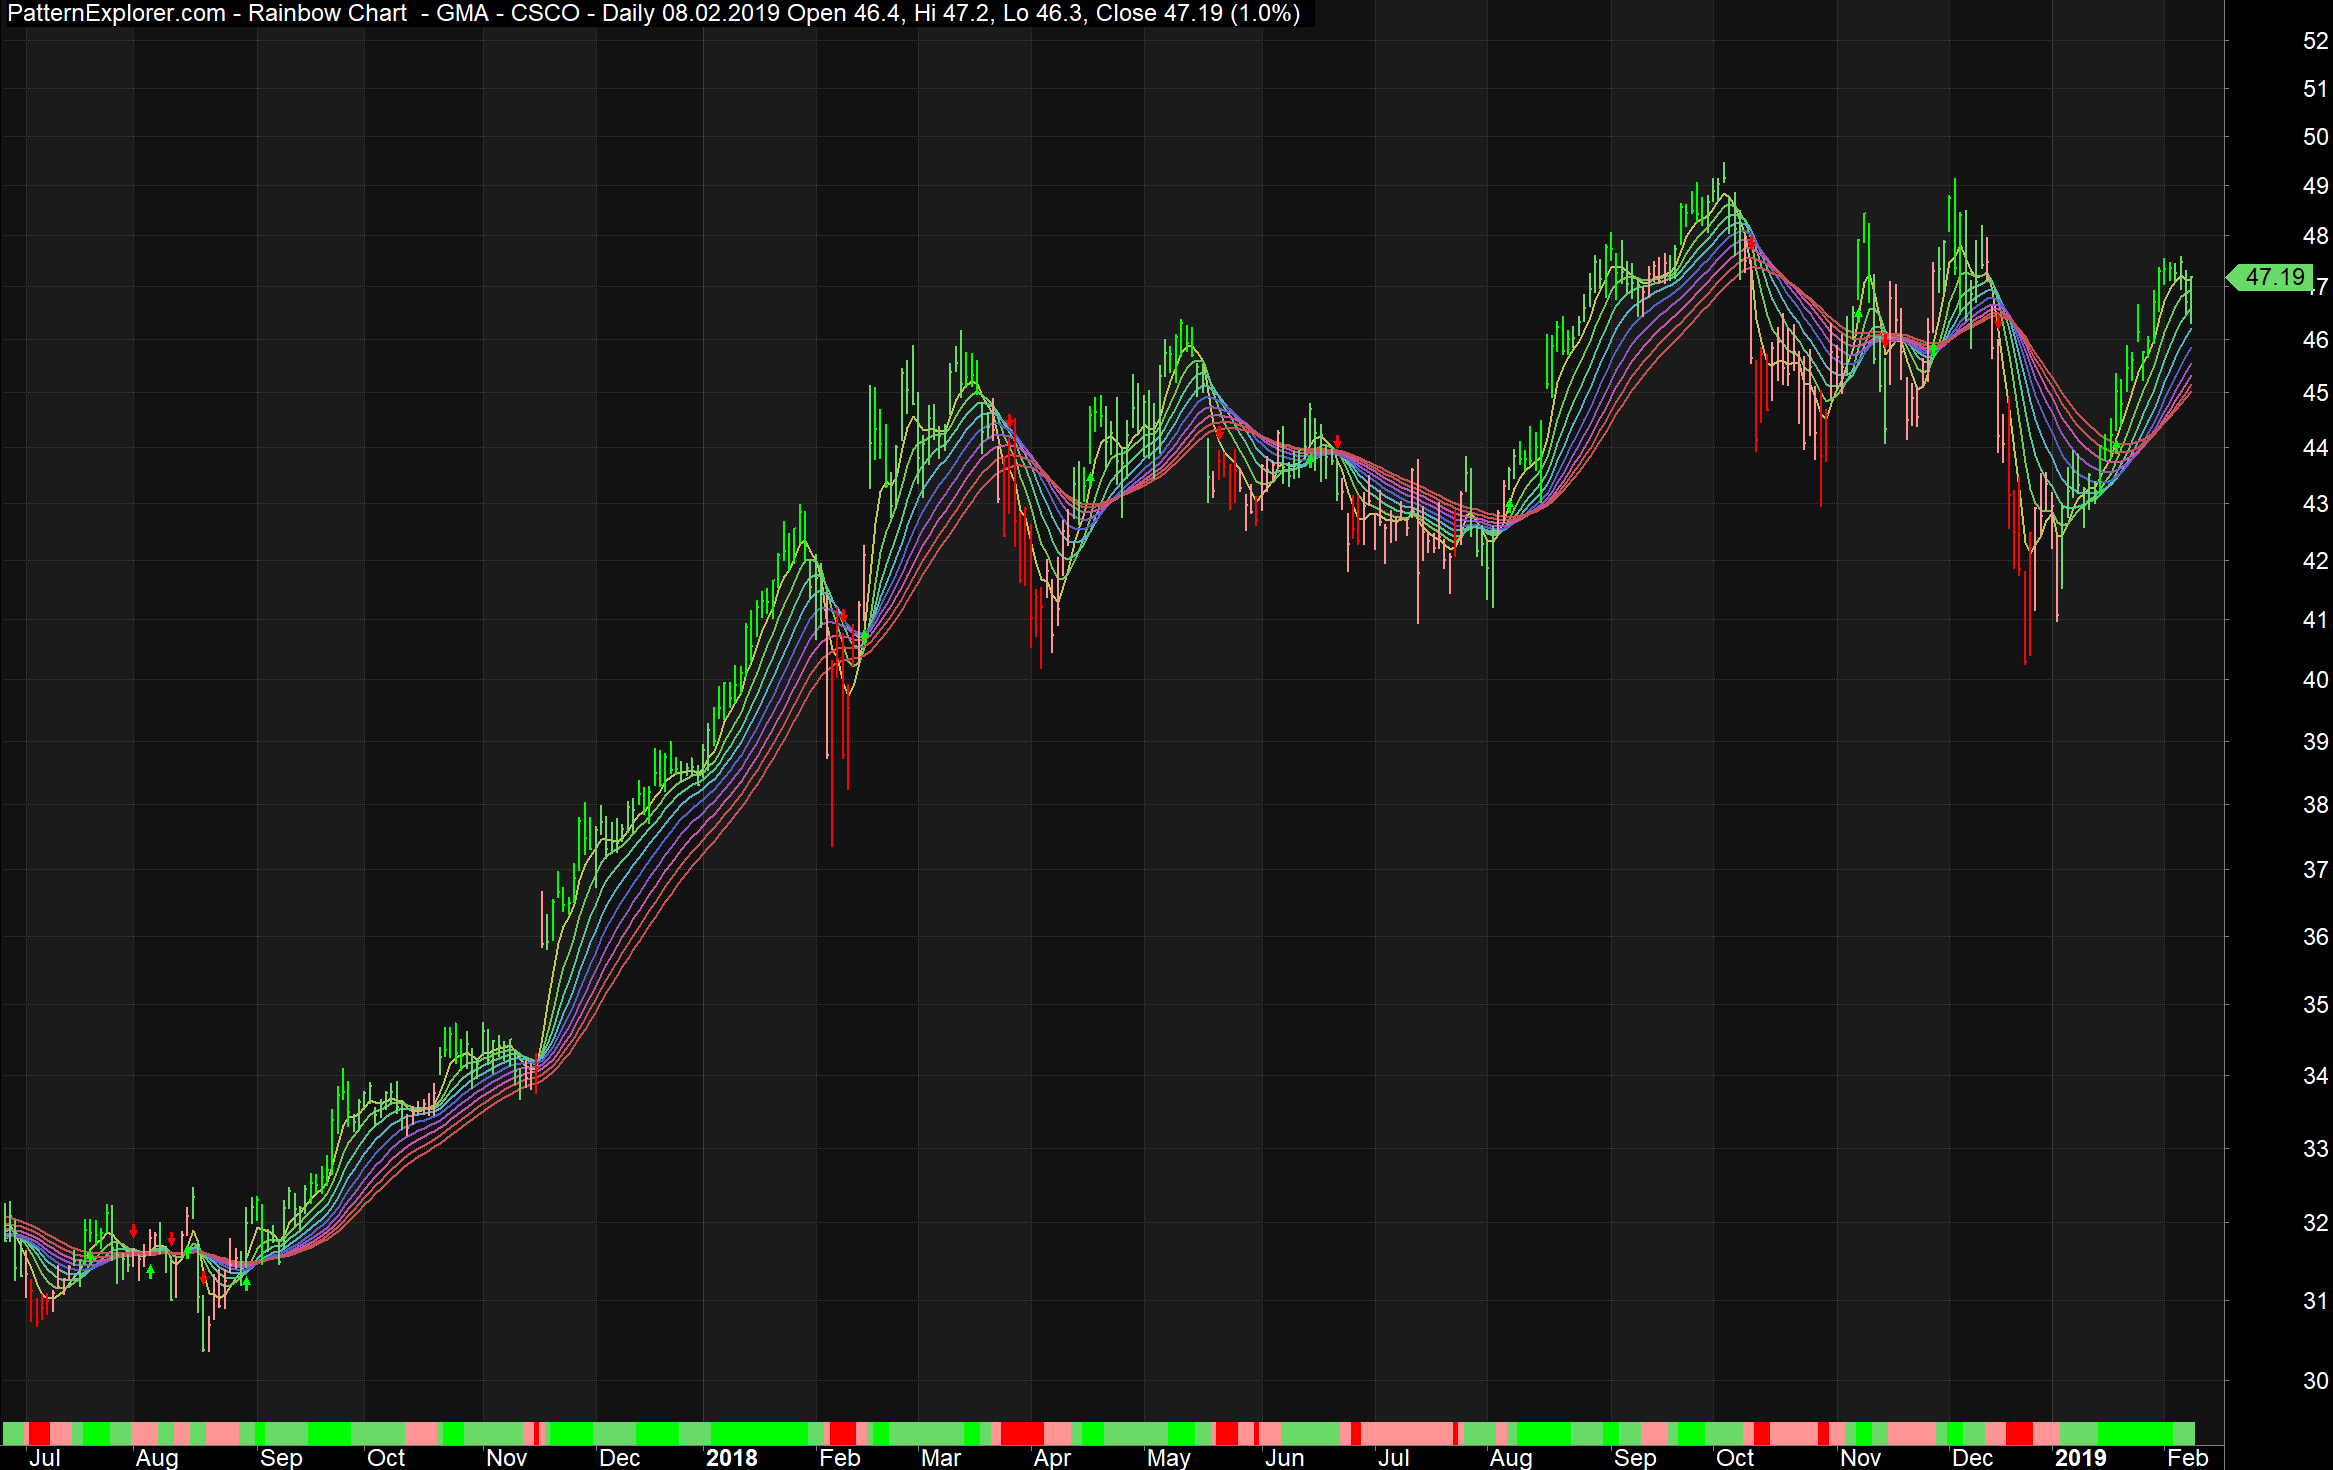
The rainbow chart plots multiple averages together. You can define the amount and types of moving averages through the parameters. Up to 10 different averages are available. Default buy & sell conditions are listed below.
This tool displays also buy and sell shapes when the fastest average crosses the slowest average.
Example settings: Fastest average period = 3, this is the average number 1. We have an increment of 2, therefore the second average period = 3 + 2 = 5, the next is 5 + 2 = 7, then 9,11,13,15,17 and 19
Average with period 20 will not be plotted because the slowest average (max. period) is defined with period 20 and the previous average has period 19. With an increment of 2, the next average period is 21.
Buy = def_Buy AND Cross(fastest, slowest);
Sell = def_Sell AND Cross(slowest, fastest);
The signal column displays buy if the fastest average crosses the slowest available average while a sell signal appears on the opposite condition.