PE – Price Chart
Price:
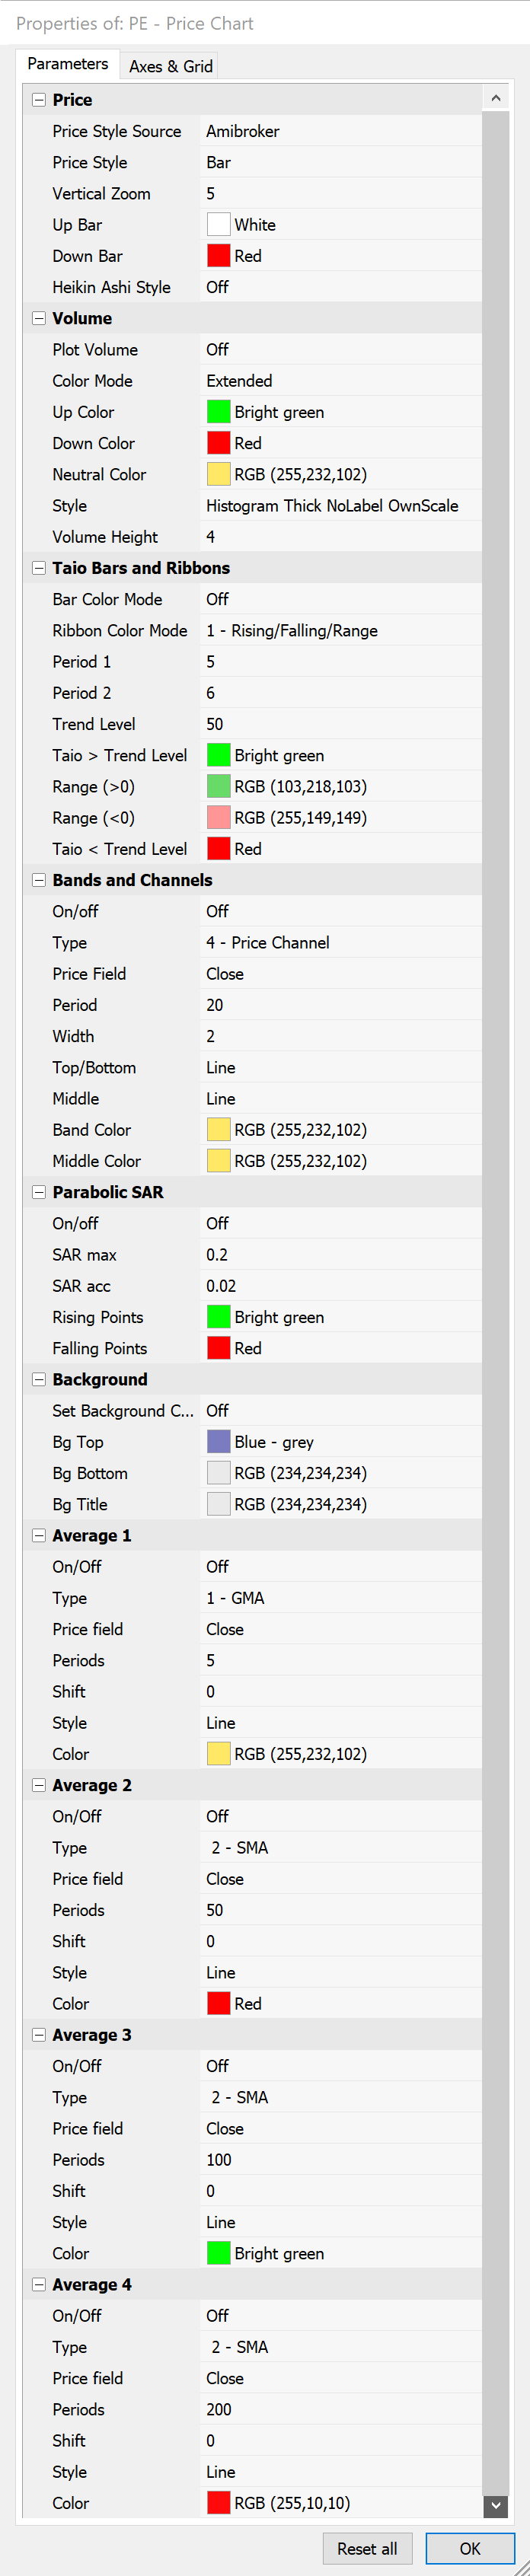
Price Style Source can be used to choose between the AmiBroker price style and PatternExplorer price style. You can select the price style (candle, bar, line) through AmiBroker settings if you use the AmiBroker style. With PatternExplorer style selected the chart uses the chosen parameters from the dialog.
Price Style allows choosing between
Vertical Zoom
For some tools, it is useful to zoom out the chart to assure that lines and prices are not behind the title. Use higher values to zoom out.
Up bar
Use this parameter to define the color of bars or candles where the close is greater or equal than the open price.
Down bar
Use this parameter to define the color of bars or candles where the close is lower than the open price.
Volume:
Different options to adjust the color of the bars depending on the volume behavior.
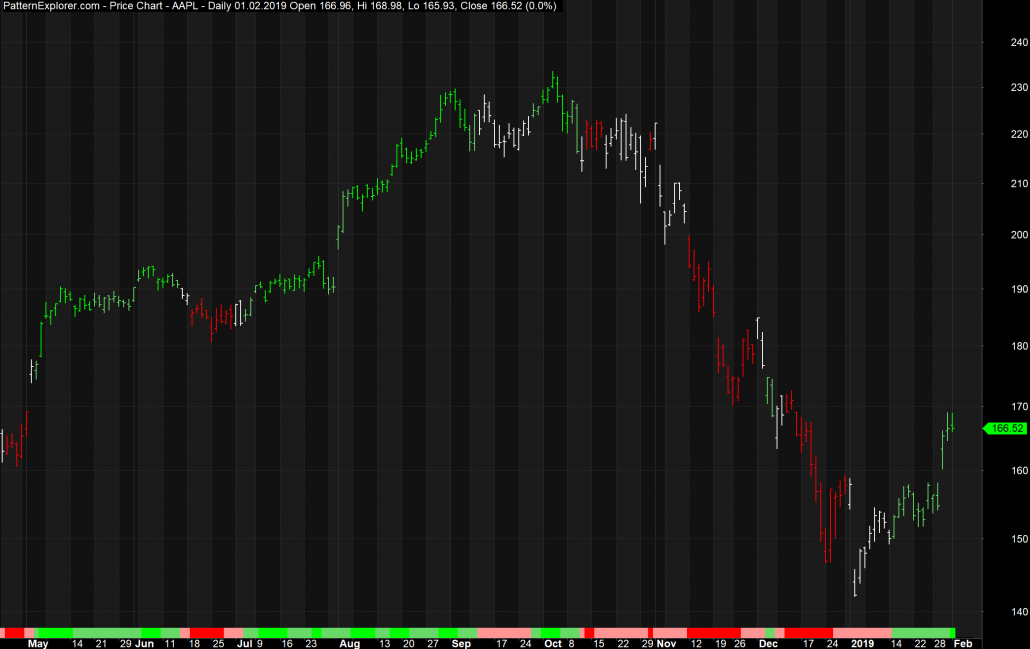
Taio Bars and Ribbons:
This section can be used to adjust the bar/candle color automatically based on the Taio indicator and to change the ribbon color on the bottom of the chart. Below is a typical chart with color mode 1. Generally green means bullish while red means bearish. The chart below illustrates it more detailed.
Bands and Channels:
The calculation of the bands uses the closing price, but using any other price field is also possible.
Parabolic SAR:
Standard Stop and Reverse dots
Average 1 – 4:
Most parameters above are self-describing, except for the shift parameter. Here it has to be noted that it only shifts the plotted average. It does not use another calculation method to calculate past or future values.
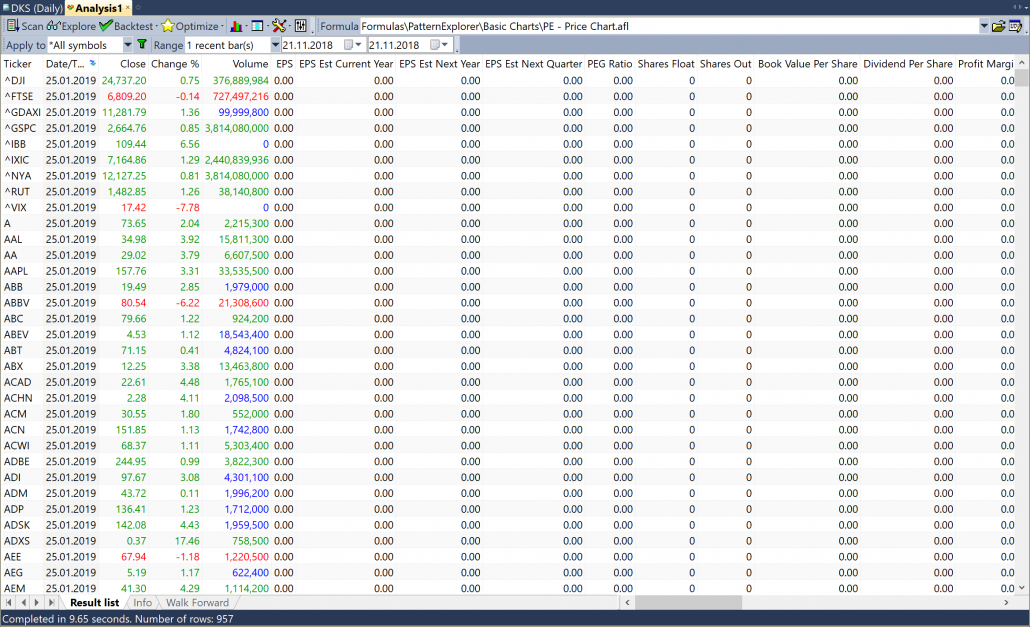
Automatic Analysis:
The price chart includes default exploration functionality, and there is no filter included. The close column displays a green close price when the close is higher than the last close, while a red one for falling prices. The gain % column shows the rate of change compared to the previous close. Green for positive gains, red for negative and blue for zero difference.
The volume column displays the current volume (see Date/Time column). Green text if volume and close are higher than previous values, red if both lower than previous values, otherwise blue. Most tools also include this column.
On the following pages the shortcut AA is used as an abbreviation for Automatic Analysis. The example below illustrates the results of the price chart exploration. Note that values are zero if the data provider doesn’t provide fundamental data.